
Recognized for AI Excellence at 2026 Globee® Awards - Read More
Data Visualization Consulting Services
High-Fidelity Visual Decision Systems and Intelligent Dashboards Built on Enterprise Data
Our Data Visualization Solutions
Data-Driven Decision Frameworks
Let us engineer your data specifically for decision-making. We create data-driven decision frameworks that convert fragmented, multi-source information into visualization-ready intelligence. Radixweb’s data engineers utilize data modeling and analytics to create charts, graphs, reports, and dashboards.
Our data visualization frameworks reduce dependency on manual reports and generate evidence-based insights for various business functions. Organizations typically cut analysis time by more than half and replace reactive reporting cycles with predictable, decision-ready intelligence.
Real-Time Dashboard Development
Build interactive dashboards for high-volume, high-velocity data environments. We develop BI and data visualization architectures capable of processing and displaying updates at intervals as low as 3 to 10 seconds.
As we integrate streaming data pipelines, cloud data platforms, and enterprise BI tools like Power BI, Tableau, or custom React-based interfaces, these data visualization dashboards monitor live performance in sales, operations, supply chain, finance, and risk. System latency is reduced by up to 60% compared to traditional reporting models.
AI-Powered Insight Generation
Our data visualization consulting services include using AI to generate advanced insights. We train and deploy ML models that identify hidden patterns, forecast operational trends up to 6-12 months ahead, and flag irregularities with accuracy levels reaching 95-99%.
Using the visual interface, teams gain access to automated root-cause indicators, predictive scenario mapping, and contextual recommendations, without requiring data science expertise. Allow your stakeholders to work with relevant insights that are continuously updated as new data enters the system.
Self-Service Analytics Enablement
Design and develop self-service analytics platforms. Allow your team across departments to explore and interpret data independently, without dependency on technical intermediaries. Leveraging semantic data layers and pre-modelled datasets, our data visualization experts enable business users to secure ad-hoc analysis.
In most of our engagements, reliance on central data and reporting teams is reduced by 50 to 65% within the first quarter of analytics implementation. As adoption increases, enterprises gain faster internal insight generation with lower operational strain on central data and analytics resources.
What We Deliver in Data Visualization Consulting
Data Visualization Strategy & Roadmapping
Consult with our data visualization specialists to create a complete project roadmap. We evaluate your current reporting structures, decision gaps, and data maturity to define prioritized use cases, required data sources, platform architecture, and rollout phases, along with additional performance, governance, and scalability considerations.
Data Modeling, Integration & Preparation for BI
Create data models and pipelines to convert raw data into analytics-ready models optimized for business intelligence and data visualization platforms. We design semantic models, integrate disparate sources (databases, APIs, cloud platforms), and build optimized datasets that power fast-performing dashboards and analytics.
Custom Dashboard and Report Development
Data engineers at Radixweb have extensive experience in designing custom dashboards and reporting systems tailored to executive, operational, and departmental needs. We build role-based, interactive dashboards using Power BI, Tableau, Looker, or your preferred platform. Dashboards are designed for usability and tested with real users to validate adoption.
Cloud Data Visualization Architecture & Scaling
Our cloud-based data visualization services allow teams in different locations to access the same dashboards at the same time. We build analytics on Azure, AWS, or Google Cloud, implement cloud-native BI solutions, and optimize cloud costs. As data volume and user demand increase, dashboards continue to perform without disruption.
AI-Powered and Predictive Visualization Systems
Turn your dashboards from static reports into intelligent decision engines. We build AI-driven dashboards featuring natural language querying, automated anomaly detection, predictive models, and ML-based insights. Decision-makers get early signals to course-correct, prepare for demand changes, or identify risks before they become visible through standard reporting.
Real-Time & Streaming Data Visualization
Let's architect and build live dashboards powered by streaming data platforms like Kafka and Kinesis, implement IoT visualization for operational monitoring, create control room dashboards for time-critical decisions, and enable instant KPI monitoring. Get immediate response to opportunities and risks rather than reacting to historical data.
BI Tool Implementation, Migration & Optimization
Our data visualization consulting services include the complete, end-to-end implementation of Power BI, Tableau, Looker, or Qlik, whether implementing a new platform or migrating from legacy systems. We cover initial discovery and requirements gathering through design, deployment, data integration, user training, and ongoing support.
Data Visualization Audit and Compliance services
Audit your entire BI infrastructure to identify risks and opportunities. We conduct comprehensive reviews of dashboard design, governance frameworks, security controls, and regulatory compliance (HIPAA, GDPR, SOX). Our audit provides visibility into your data visualization ecosystem's health and suggests optimization strategies.
Workshops, Training & Enablement Programs
Radixweb's data visualization specialists run exclusive workshops for business users, power users, and technical teams. Our programs teach self-service analytics skills, governance practices, and tool-specific expertise. Through instructor-led training, documentation, and ongoing support, we build internal BI expertise and create an analytics-enabled organization
The Scale Behind Our Services
26+ years of solving enterprise challenges through cloud, data, and AI engineering.
Global Projects Successfully Executed and Delivered
Client Satisfaction Score in Engagements
Years Average Tenure of Senior Consultants
Star Rating for Engineering Skills and Delivery Quality
Trusted by Growing and Global Brands


Radixweb’s data visualization consulting services transform complex data into clear charts, dashboards, and visual insights to support informed decision-making. We help enterprises work with a consolidated, dependable view of data that supports leadership actions based on verified visual evidence.
The system was entirely built on the client side so that all the data would load on demand. It reduced human errors by 90%, all because we don’t have to add and analyze information manually.

From the initial discussions to ongoing support, the way they look after customers, how to work across organizations, a combination of all of these makes Radixweb an amazing partner.

When it comes to their workflow, it’s entirely value driven and deadline focused. They take special care of not falling behind the schedule. Besides, they are very open to communication and take iteration requests very sportingly.


What Enterprises Achieve with Our Data Visualization Services
A Single, Trusted View of Business Performance
We engineer data from disconnected enterprise systems into a consolidated visual layer that eliminates duplicate reporting and reflects consistent business logic. Finance, sales, and operations teams access the same dashboards during reviews and planning sessions for a focused, data-led conversation.
Significant Reduction in Reporting Effort
Scalable Visibility as the Business Grows
Faster Executive and Board Decision-Making
Industries Our Data Visualization Consultants Actively Work in


Share Your Business Goals
Our senior consultants will review your data landscape and deliver a clear visualization improvement brief within five business days.
Our Current Work in Data Visualization
Work In Progress
Territory-Level Sales Performance Visualization for Underpenetrated Accounts and Revenue Recovery
We’re designing a specialized visual model for a B2B distributor that highlights dormant accounts, coverage gaps, and missed visit patterns.
- Limited data visibility across micro-territories
- Visual mapping of dormant account data
- Territory heatmaps built from sales data
- Revenue leakage identified through data
- High-potential accounts surfaced through data
Work In Progress
Real-Time Data Visualization for Liquidity Risk Monitoring in Multi-Entity Banking Operations
A finance firm is developing a data visualization system to monitor cash positions and risk indicators for treasury and senior finance leadership.
- Fragmented liquidity data across legal entities
- Building real-time treasury data dashboards
- Visualizing data-driven liquidity risk thresholds
- Detecting anomalies in intraday data movement
- Supporting faster data-led funding decisions
Data Visualization Applications and Use Cases We Cover

Executive Financial Dashboards
As a data visualization company, we build dashboards to give finance leaders a consolidated view of revenue, expenses, margins, cash flow, and forecasts in one place. CFOs and finance teams can track performance as it changes, identify variances early, and adjust budgets or spending decisions.
Sales Pipeline Visualization
We centralize sales and CRM data, structure it by stage, region, and deal size, and engineer it into a visual pipeline model. This enables dashboards that clearly show pipeline flow, drop-off points, deal velocity, and revenue gaps to support proactive sales planning and data-driven resource allocation.
Marketing Attribution Dashboards
Integrate your marketing platforms, campaign tools, and web analytics data into a visual platform with our data visualization consultants. Develop dashboards that connect spending to performance for marketing teams to visualize true attribution and optimize channel and campaign investment.
Supply Chain Visibility Mapping
Let us engineer data from your inventory systems, shipment trackers, and supplier feeds into a live, location-based visual model. Our data visualization dashboards show stock levels, movement patterns, supplier delays, and route status, so that teams can quickly interpret disruptions and make informed logistics decisions.
Healthcare Performance Dashboards
We help healthcare administrators and decision-makers monitor patient flow, bed occupancy, appointment volumes, staff utilization, and operational efficiency through dashboards designed for rapid understanding and immediate operational action. This supports better allocation of resources and improved planning for peak demand periods or emergencies.
Manufacturing Operational Intelligence
Work with our data scientists and engineers to build data visualization and business intelligence dashboards that track production output, machine performance, downtime, and quality metrics. We enable manufacturing leaders to gain real-time operational insight, respond faster to equipment issues, and maintain consistent production levels.
SaaS Metrics Visualization
Product and revenue teams use our data visualization and analytics solutions that provide clear visual tracking of SaaS KPIs such as MRR, churn, user engagement, activation, and retention. We help SaaS teams identify drop-off points, improvement opportunities, and revenue risks early.
Workforce Analytics Reporting
Radixweb’s data visualization services include building workforce analytics dashboards that display headcount trends, attrition rates, hiring pipelines, and team distribution. HR and leadership teams gain real-time business intelligence to support better workforce planning and strategic talent decisions.
Compliance and Audit Monitoring Dashboards
Translate control, transaction, and process data into clear visual checkpoints aligned with your compliance requirements. These dashboards show status, exceptions, and remediation progress in an accessible format for leadership and audit teams to monitor readiness and reduce reporting gaps.
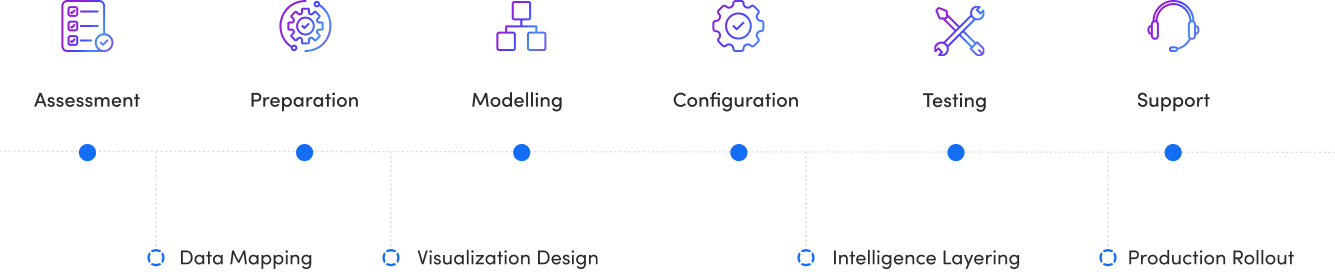
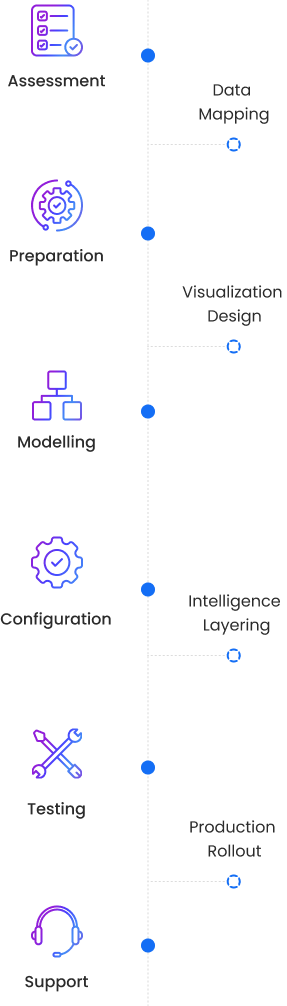
How We Build Data Visualization Solutions
Our data visualization consulting process has been refined through years of project execution. Because your business data is highly sensitive and decision-critical, we follow a careful approach that prioritizes transparency and accountability throughout all the stages of delivery.
A Trusted Data Visualization Consulting Company
Data has remained the foundation of our digital expertise. Our data visualization consulting and engineering services are focused on modeling and visualizing data to help enterprises operate with accurate, decision-ready insights.
- Translating business questions into structured visual logic
- Simplifying data complexity for executive understanding
- Designing visual systems that evolve as priorities change
- Cross-department alignment with shared visual language
Tools and Technologies We Use to Visualize Data
- Data Sources
- Data Engineering & Integration
- Cloud Data Platforms & Warehousing
- Data Transformation & Modelling
- BI & Visualization
- AI/ML & Analytics
- Real-Time & Streaming Data
- Security, Monitoring & Governance
Recognition Earned for Delivery Excellence


Frequently Asked Questions
How do data visualization consulting services help organizations turn data into business decisions?
How much does it cost to build enterprise data visualization solutions?
Which industries gain the most value from data visualization initiatives?
How does effective data visualization improve collaboration across departments?
How do consulting teams deliver visualization projects for global clients?
How do consultants measure ROI from data visualization projects?
How does data visualization integrate with advanced analytics or AI?
Share your dashboard and reporting requirements. We’ll return a fixed, line-item quote with clear deliverables, development time, and support coverage.