
Read More

Recognized for AI Excellence at 2026 Globee® Awards - Read More
Mobile App Usage Statistics 2026: Key Insights, Trends, and Growth Drivers

Akash Kareliya
Updated: Nov 17, 2025

ON THIS PAGE
- Key Mobile App Statistics 2026
- Mobile App Usage Statistics
- Mobile App Revenue Statistics
- Mobile App Download Statistics
- What’s the Reason Behind Mobile App Growth?
- How Many Apps Are Downloaded Each Day?
- Free vs Paid Mobile App Downloads
- Mobile App Industry Statistics
- Mobile App Development Statistics
- Mobile App User Growth Statistics
- Mobile App Retention Rate Statistics
- Mobile App Engagement Statistics
- Application Development Statistics
- Conclusion
Quick Recap: Did you know that the average user now spends over 4.5 hours a day on mobile apps. Well, that’s more time than on TV or desktops combined? This blog explores the latest 2026 mobile app usage statistics to uncover how users interact, engage, and stay loyal to apps in an increasingly mobile-first world.
Ever wondered how much of your day you spend using apps? From ordering your meals to tracking your workouts, mobile apps are quietly running nearly every moment of our lives. In 2026, they’re not just applications, but they’re ecosystems shaping how we connect, shop, work, and play.
With users spending over 4.5 hours a day on their phones and global downloads exceeding 260 billion, it’s clear: the mobile revolution is only getting stronger. For businesses, this isn’t just a trend, it’s a signal: mobile apps are fast becoming the primary interface between brands and users.
Global app downloads surpassed 218 billion last year and continue to rise, underscoring how central apps are in consumer lives.
This blog talks about the latest mobile app usage statistics that reveal what keeps users hooked, what drives retention, and how brands can turn data into growth. So, whether you’re building the next-gen mobile applications or optimizing your existing one, these insights will help you stay ahead in the ever-evolving mobile landscape.

Key Mobile App Statistics for 2026
- The global mobile app market is expected to exceed $1 trillion by 2034, highlighting the industry’s rapid long-term growth potential.
- In 2024, the Google Play Store dominated the market with 102.4 billion app downloads, while the Apple App Store saw 35.4 billion downloads, reflecting the continued strength of Android’s global footprint.
- Of the total downloads, 46.9 billion were gaming apps, while 91.3 billion belonged to non-gaming categories, emphasizing the growing diversity of app usage beyond entertainment.
- Around 136 billion apps were downloaded globally in 2024, marking a slight 1% year-over-year decline as user focus shifts toward retention and in-app engagement.
- Consumer spending on mobile apps reached nearly $40 billion in Q1 2025, showing strong user willingness to pay for digital convenience and experiences.
- 35% of total mobile time in 2024 was spent on social media apps, reflecting the dominance of content-driven and community-focused platforms.
- The average user spent 3.5 hours per day within mobile apps, cementing apps as the core of everyday digital activity.
- AI chatbot apps recorded a remarkable 112% year-over-year growth, becoming the fastest-growing category among all app types.
- The year 2024 already saw 137.8 billion app downloads, a figure predicted to grow substantially through 2026 as emerging markets drive new user activity.
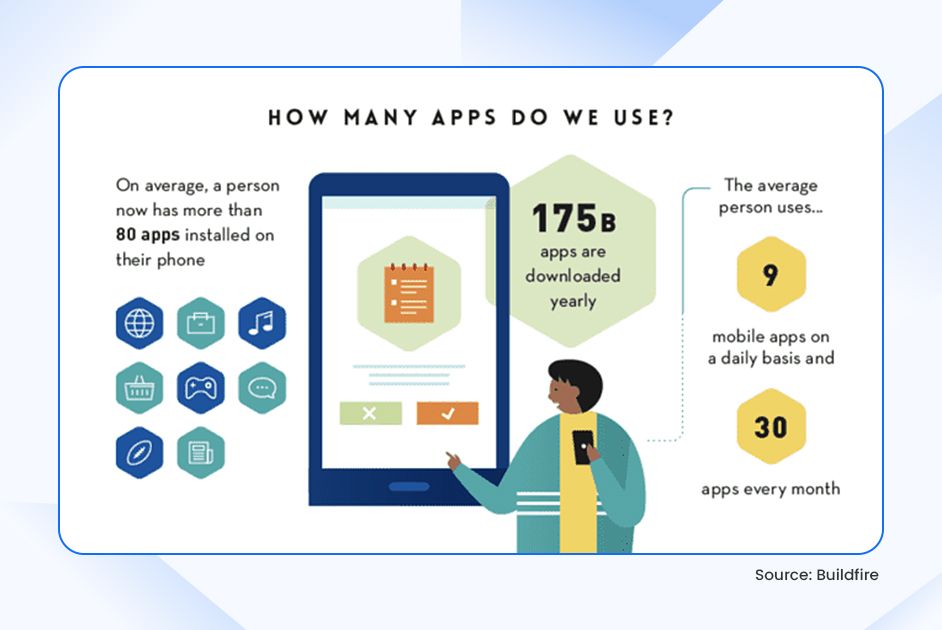
- On average, users interact with around 9 mobile apps daily and 30 per month, revealing how deeply integrated apps have become in daily routines.
- The global mobile app market size, estimated at USD 289 billion in 2025, is expected to maintain double-digit growth through 2026, driven by new technologies like AI, AR, and super-app ecosystems.
- Nearly 49% of users open an app more than 11 times a day, highlighting the deep level of engagement mobile apps now command.
- Among Millennials, 21% check apps over 50 times daily, making them the most active mobile user demographic.
- In the United States, 70% of total digital media time is spent within mobile apps — solidifying their dominance over desktop and mobile web browsing.
- The average smartphone user interacts with around 10 apps daily and about 30 different apps each month, balancing productivity, communication, and entertainment.
- The global mobile app market is projected to surpass $1 trillion by 2026, signaling unprecedented opportunities for businesses and developers.
- Gaming apps continue to lead the market, representing approximately 56% of total global downloads.
- Subscription-based apps have seen strong growth, now contributing to nearly 40% of total app revenue.
- Social media and entertainment apps dominate user attention, accounting for over 40% of total mobile app usage.
- The Android ecosystem remains the largest by volume, with billions of app downloads recorded annually.
- The overall mobile app industry is expected to maintain an annual growth rate of 8–10%, driven by innovation in AI, AR, and cross-platform development.
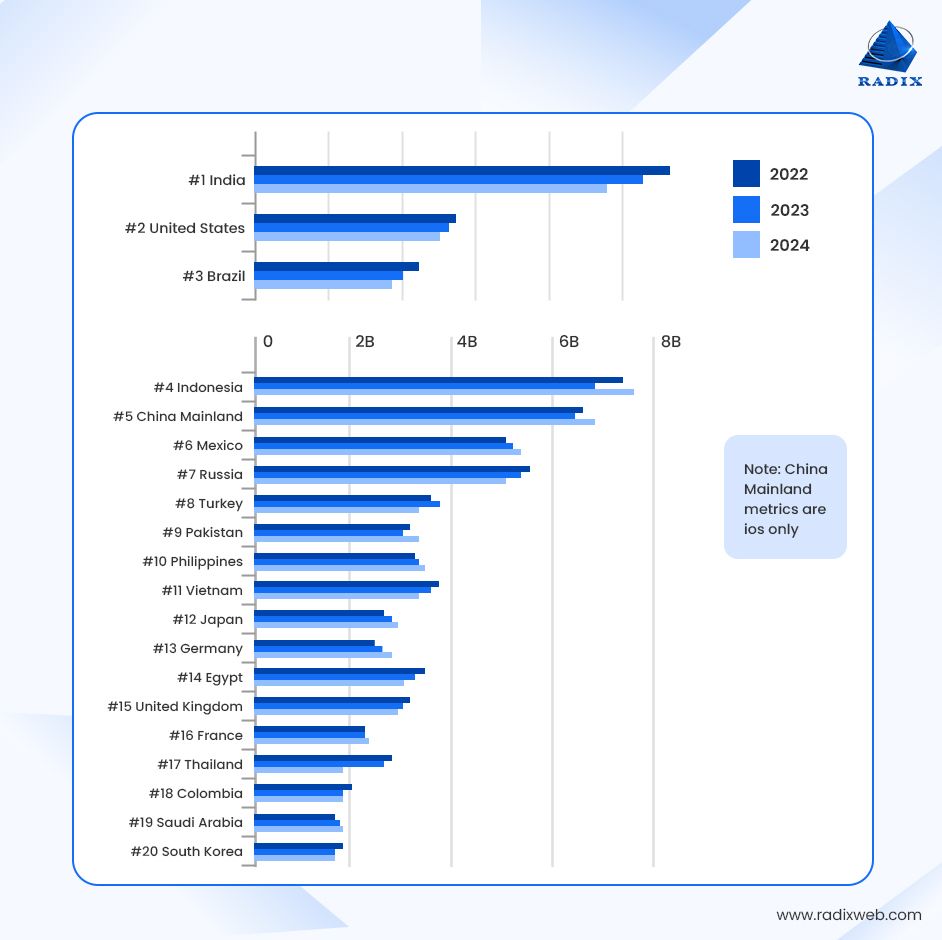
- As per the data, emerging markets are leading the charge in app adoption — particularly India, Brazil, and Indonesia, which have become key growth hubs. India alone recorded a staggering 190% increase in app downloads, far surpassing the 5% growth rate in the United States during the same period.
Mobile App Usage Statistics
Mobile app usage stats hold tremendous significance in unraveling user behavior mysteries and enhancing app experiences. These statistics provide a window to users' minds, allowing businesses to understand their preferences, habits, and interactions within the app.
Organizations can quickly uncover valuable patterns and mobile app development trends shaping how users engage with apps by analyzing these statistics. Think about a scenario where you have the power to see which features are the most popular, how long users spend on specific screens, and even the steps they take within the application; that is interesting, right?
These insights will act as a treasure trove of information, guiding app developers and business owners to make informed decisions to enhance user experiences and drive success.
- Users spend over 3.5 hours per day inside mobile apps globally, signaling high engagement levels.
- The global mobile app market is projected to surpass USD 500 billion by 2026, highlighting enormous revenue potential.
- Unique mobile users worldwide reached 5.78 billion in October 2025, which is about 70.1% of the global population.
- In 2024, approximately 136 billion apps were downloaded globally (a slight –1% year-on-year change), indicating a maturing download market but still vast scale.
- Shopping-app users spend about 201.8 minutes per month in shopping apps, compared with only about 10.9 minutes in mobile websites—showing apps dominate when it comes to mobile commerce.
- In the U.S., mobile apps account for 70% of all digital media time, illustrating how dominant apps are compared to desktop or browser usage.
- Gaming remains a major category: average gaming-app session length globally is 30.75 minutes, with 1.82 sessions per user per day in “hyper-casual and hybrid casual” games.
- In 2025, the number of smartphone owners globally reached 4.69 billion, which sets the user-base foundation for apps.
- Among consumers, 56% shop on mobile apps at least once a week, and higher-income households show 82% app adoption rate for shopping.
- The average smartphone user has approximately 40 apps installed, but actively uses only a fraction of them—highlighting the challenge of engagement over merely acquisition.
- Emerging markets such as India had over 1.03 billion internet users (70% penetration), a key driver for mobile app growth.
- In 2025, around 65% of consumers used 3-10 mobile apps daily.
- The global mobile app market size was estimated at US$289 billion in 2025, with forecasts to exceed US$1 trillion by 2034.
- An average smartphone user has about 40 apps installed, but uses only about 9-10 apps daily and roughly 30 apps monthly.
- In 2024, 35% of mobile device time was spent on social media apps.
- The average smartphone user spends about 2 hours 20 minutes per day in social media apps (70 hours per month).
- In the U.S., mobile apps account for approximately 70% of all digital media time, surpassing desktop and mobile web usage.
These are a few mobile application usage statistics; now, let us shed some light on the mobile app usage trends. Are you wondering what these are?
As a business, you need to note that mobile app usage trends are constantly evolving, and they offer fascinating insights into how people usually interact with apps.
For instance, one of the most prominent trends is the increasing use of mobile apps for various purposes, such as social media, entertainment, shopping, and productivity. Another trend is the rise of mobile gaming and on-demand services. Plus, there is a surge in health and fitness applications as people prioritize their well-being and health.

Mobile App Revenue Statistics
Mobile app revenue statistics hold immense importance in the app industry. They provide valuable insights into the financial success of apps and their impact on the global economy. With the help of these digits and insights, app developers and businesses can make informed decisions about their strategies, such as analyzing the most profitable app categories.
Plus, companies can get valuable insights into the financial success of the app industry. Market research in mobile app development holds immense value. So, let us now take you into the realm of mobile app revenue stats.
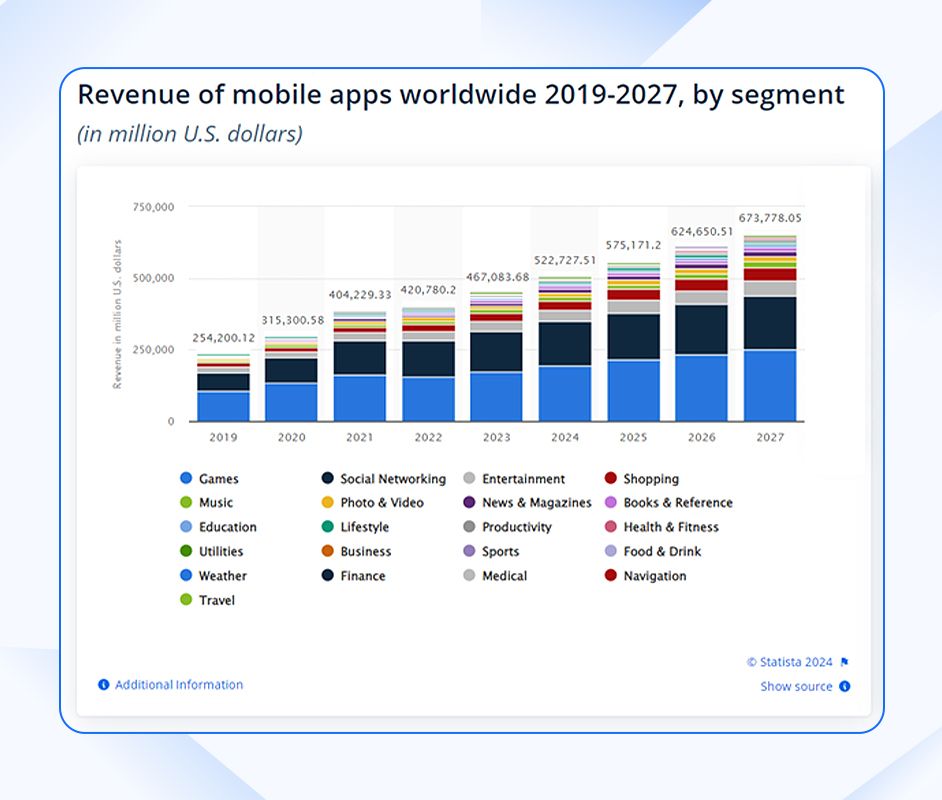
- Revenue (in million US Dollars) from mobile apps worldwide has been rising rapidly, with a predicted value of 522,717.51 in 2024 to 673,778.05 in 2027.
- According to reports by Statista, 50% of the web traffic comes from mobile devices.
- Mobile apps are projected to generate a whopping $935 billion in revenue in 2024.
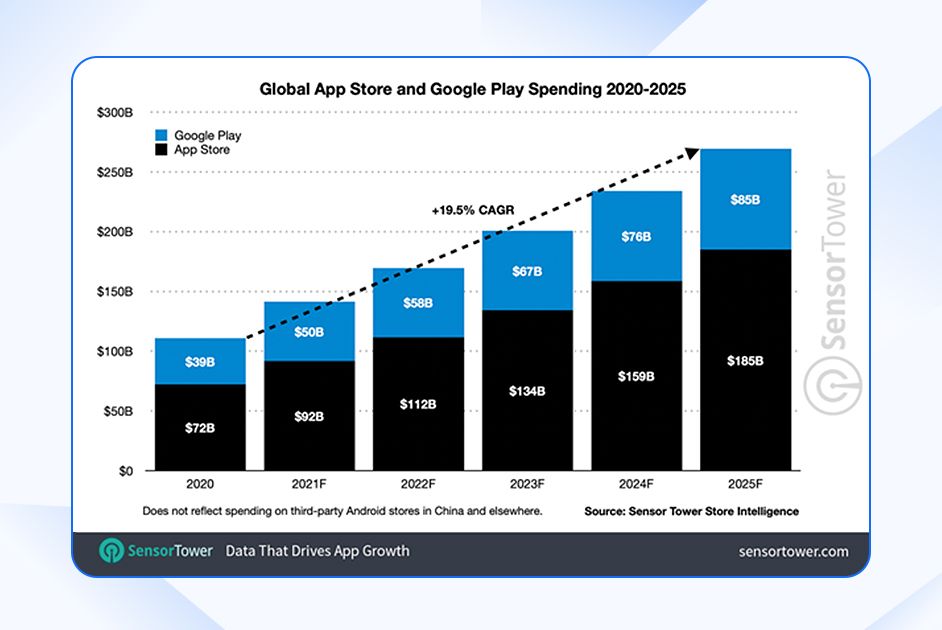
- According to the latest data, the gross revenue for both the App Store (AS) and Google Play (GP) would rise at a CAGR of 19.5% by the end of 2025. The breakup would be $76 billion (GP) and $159 billion (AS) for 2024, while it would rise to $85 billion (GP) and $185 billion (AS) in 2025.
- 98% of the mobile app revenue worldwide is directed from free applications.
- Total revenue of mobile apps is expected to grow at a CAGR of 9.27% from 2022-2026, with a value of 614.40 billion USD by 2026.
- The renowned Uber Technologies received $200K in seed funding as for mobile app development cost. However, its mobile app revenue was <$5K in February 2024 with Uber-Request a Ride as the top grossing app.
- The app revenue sector increased over the years and generated approximately USD 613 billion in 2025.
- Paid applications are predicted to generate less than USD 7 billion from app purchases by 2026.
Mobile App Download Statistics
Mobile apps are projected to reach 299 billion downloads worldwide, up from 257 billion in 2023. That’s an 8% Compound Annual Growth Rate (CAGR).
Mobile app download stats provide valuable insights into the popularity and reach of different apps, helping businesses understand which ones are capturing users' attention. These digits reveal the number of times an app has been downloaded, giving organizations a glimpse into its overall success.
Simply put, it is more like peeking into the universe of mobile applications and analyzing which ones shine the brightest. These digits are crucial because they help developers, businesses, and even users to make informed decisions. With it, mobile app developers can quickly gauge their app's success and identify areas for improvement, while businesses can analyze popular app categories to inform their marketing strategies.
- Every year, 255 billion mobile applications are downloaded globally.
- There have been 35-36 billion app downloads combined from the Google Play and Apple App Store.
- With around 100 billion downloads annually, mobile games are the most popular genre. Then, with approximately 20 billion downloads, mobile photo and video apps come in second.
- 6.3 million people download several mobile apps daily, and approximately 250 million are downloaded daily. Plus, this number is increasing at a rapid pace.
- Many mobile phone users have at least 80 mobile applications installed.
- Out of 1,889,653 Apple App Store apps, 95.09% are free apps while 4.91% are paid apps that need to be purchased.
- Out of 3,466,806 Google Play apps, 96.93% are free apps while 3.07% are paid apps.
Global App Download Projections (2023–2027)
Let’s examine the projected growth of global app downloads from 2023 to 2027, highlighting key trends that will shape the future of mobile adoption worldwide.
| Year | Global Downloads | YoY Growth | Key Triggers |
|---|---|---|---|
| 2023 | 257Bn | 6% | Post-pandemic recovery |
| 2024 | 277Bn | 7.8% | 5G rollout in 50+ countries |
| 2025 | 299Bn | 8% | Emerging market smartphone boom |
| 2026 | 324Bn | 8.4% | Increased adoption of mobile-first services |
| 2027 | 350Bn | 8% | Expansion of IoT and smart devices integration |
What’s the Reason Behind Mobile App Growth?
Let's explore the key factors driving the rapid rise of mobile app usage and development across global markets.
Smartphone Boom
- Global Reach: In 2025, nearly 5.3 billion people—that’s 83% of the global population—are expected to own a smartphone, expanding app accessibility like never before.
- India’s Momentum: In 2024 alone, India added 120 million new smartphone users, marking one of the fastest adoption rates worldwide and fueling a thriving mobile-first economy.
Affordable Internet Access
- Data Democratization: With data costs dropping dramatically, countries like Nigeria now offer 1 GB of data for as little as $0.50. This affordability has unlocked new opportunities for app adoption and everyday mobile engagement.
The Power of 5G
- Global Rollout: Over 75 countries have already deployed 5G networks, paving the way for faster connectivity, richer streaming experiences, and next-gen innovations like AR gaming and real-time collaboration apps.
Why It Matters
For every 1,000 mobile apps launched, only one truly succeeds in capturing user attention. In such a competitive space, understanding the drivers of growth, user behavior, and market shifts isn’t just useful, it’s essential for building apps that stand out and scale.
How Many Apps Are Downloaded Each Day?
Global app activity continues to skyrocket. Based on 2025 projections, over 299 billion apps will be downloaded this year; that’s roughly 819 million downloads every single day!
But these averages don’t tell the full story. App download patterns often surge during major events and holidays, creating powerful opportunities for visibility and growth.
Event-Driven Download Spikes
- Black Friday: Daily downloads can soar to 1.5 billion, led by eCommerce apps like Amazon, Temu, and Shein.
- Christmas Day: Downloads peak around 1.3 billion, dominated by entertainment and streaming platforms such as Netflix, Disney+, and popular mobile games.
- Major Game Releases: Launches of blockbuster titles like Genshin Impact or Call of Duty Mobile can push global downloads up to 1.1 billion in a single day.
When Downloads Peak
- Evenings (7 – 10 PM): Nearly 40% of daily downloads occur during this window as users unwind after work or school.
- Weekends: Download activity rises by 25% compared to weekdays, driven by more leisure time and in-app promotions.
Pro Tip: Timing matters. Aligning your app releases or updates with holiday seasons, special events, or peak activity windows can significantly amplify installs and engagement.
Free vs Paid Mobile App Downloads
This section compares the performance and popularity of free and paid mobile apps, revealing how user preferences shape download trends.
| Metric | Free Apps | Paid Apps |
|---|---|---|
| % of Total Downloads | 98% | 2% |
| Top Categories | Social, Gaming | Productivity, Design |
| Avg. Revenue/User | $0.80 (primarily from ads) | $4.50 (mainly from subscriptions) |
| Day 30 Retention | 12% | 22% |
| User Lifetime Value | $5.20 | $45.00 |

- TikTok: Despite being free to download, TikTok generated a massive $18 billion in ad revenue in 2024, proving the power of large-scale engagement and influencer-driven marketing.
- Procreate Pocket: A one-time $5 purchase app that has attracted over 2 million paid users, showcasing the continued success of premium creative tools.
- Notion: Leveraging a freemium model, Notion earns around $10 million per month from premium plan subscribers, a testament to the growing demand for productivity apps.
- Emerging Trend: Roughly 45% of paid apps now offer a 7-day free trial, using short trial periods to boost conversions and retain long-term users.
Top Countries by App Downloads
Let's go through those countries leading the world in mobile app downloads and what’s driving their rapid digital adoption.
| Rank | Country | 2025 Downloads (Billion) | 2025 Growth vs 2023 | Top Categories |
|---|---|---|---|---|
| 1 | India | 78 | +18% | Gaming, Fintech, Social |
| 2 | China | 72 | +6% | Super-Apps, E-commerce |
| 3 | USA | 38 | +4% | Streaming, Fitness, Productivity |
| 4 | Brazil | 30 | +22% | Social, Shopping |
| 5 | Indonesia | 22 | +15% | Gaming, Ride-Sharing |
| 6 | Nigeria | 18 | +320% | Fintech, Betting |
| 7 | Russia | 16 | +8% | Gaming, Utilities |
| 8 | Mexico | 14 | +12% | Social, Entertainment |
| 9 | Japan | 12 | +3% | Anime, Productivity |
| 10 | Vietnam | 10 | +45% | Social, Gaming |
- India’s Dominance: Home to over 800 million smartphone users and some of the world’s most affordable data plans (as low as $0.10 per GB), India continues to lead the globe in mobile app downloads. Its rapidly expanding digital ecosystem fuels growth across eCommerce, gaming, and fintech sectors.
- Nigeria’s Surge: Nigeria has emerged as one of the fastest-growing app markets, with fintech downloads rising by 320% between 2023 and 2025.
- Platforms such as Opay and Flutterwave are revolutionizing digital payments and expanding financial access for millions previously underserved by traditional banking.
The next wave of mobile app growth is being driven by emerging markets in Africa and Southeast Asia, where digital adoption is accelerating at record speed. Several key factors are fueling this surge:
- Affordable Smartphones: The availability of budget-friendly Android devices, some priced as low as $50 from brands like Transsion (Tecno, Infinix), has made smartphone ownership accessible to millions of new users.
- Low-Cost Data Access: With mobile internet plans costing as little as $1 per month in several regions, connectivity barriers are rapidly disappearing.
- Localized Content: Apps designed in regional languages and culturally relevant formats — such as Hindi, Tagalog, and Vietnamese, are witnessing explosive adoption, reflecting the importance of hyperlocal user experiences.

Mobile App Industry Statistics
Mobile app industry stats provide businesses with a treasure trove of information about the financial success and impact of the app industry. These digits provide insights into the revenue generated by mobile apps, highlighting their significant role in the global economy, and an in-depth insight into the cutting-edge mobile app development services of tomorrow.
With the help of these stats, businesses can easily understand which app categories are the most profitable and spot emerging trends in the market. They are crucial because they provide valuable information for app developers and businesses, allowing them to make informed decisions regarding business strategies, investments, and monetization models.
- According to reports by Statista, the global mobile app market is estimated to reach $756 billion by 2027, at a CAGR of 8.58% during 2022-2027.
- It is noted that an average user engages with 30 applications per month.
- Of smartphone users, 51% check their apps one to ten times daily.
- Gaming applications continue to dominate the app market, with predictions of 173.4 billion by 2026, as mobile adoption and smartphone usage continue to hit new peaks.
- Global app users spent a total of 4.2 trillion hours in mobile apps in the past year.
- Global in-app purchase (IAP) revenue across iOS and Android reached US $150 billion in 2024, up 13 % year-over-year.
- The mobile application market size was estimated at US $289 billion in 2025, with forecasts to exceed US $1 trillion by 2034.
- The mobile app market generated around US $522.7 billion in annual revenue in 2024, growing roughly 12 % year-over-year.
- Mobile ad-spend reached US $390 billion in 2024, contributing a significant portion of app industry revenue.
- Free app downloads dominate: in 2025, global downloads were projected at over 300 billion apps worldwide.
- The global mobile application market is expected to grow from about US $332 billion in 2025 to US $1,288 billion by 2035, with a CAGR of 14.5%.
Mobile App Development Statistics
With the help of these stats, you will have an in-depth insight into the incredible journey where an app is brought to life. That sounds fascinating, doesn’t it? Of course, it does. As a business, you’d want to know the number of apps being developed, the platforms they are built for, and the trending tips for mobile application development, right? So, without wasting a minute, let us have a glance at the same.
- In February 2024, 48,056 apps were published or added to Google Play.
- There are 1.96 million applications available for download from the Apple App Store.
- 1251 apps are published or released every day on the Apple App Store on an average basis, while a total of 36,767 apps were released in February 2024.
- 2.87 million applications are available on Google Play Store for downloading.
- Mobile operators are investing $160 billion every year in deployment of 5G to enhance their networks.
- Around 40% of all software developers (≈ 11 million out of ~28 million globally) identify as mobile app developers.
- An estimated 95% of companies reported using low-code/no-code tools in their app development projects in the past 12 months, with 78% of those saying they saved up to 50% of development time.
- The global mobile app market size (app development inclusive) is projected to hit approximately $756 billion by 2027 with a steady growth rate through 2030.
- Key technical trends in mobile app development for 2025 include: 5G integration, AI-powered personalization, AR/VR features, IoT connectivity, and supporting foldable devices.
- The average cost to build a mobile app in 2025 ranges from $40,000 to $400,000+, depending on complexity.
- In India, app development costs typically span $10,000 to $150,000+, reflecting lower developer rates and regional pricing.
- On average, the major development phase accounts for 40%-55% of the total mobile app budget, including coding, backend and integrations.
- Maintenance and updates post-launch generally cost 15 %-20 % of the initial development cost annually.
- Cross-platform frameworks such as Flutter and React Native are seeing growing adoption — Flutter’s share rose from 10.15% in 2022 to 11.07% in 2024 for Android apps.
- Apps with advanced features (AI/ML, AR/VR, real-time collaboration) cost in the range of $100,000 to $350,000+ to develop.
- The cost to build a “simple” app (basic features) is often quoted around $30,000 to $60,000, while more complex ones can go from $150,000 to $350,000+.
- The global “low-code/no-code” development market is projected to grow significantly, making development faster and potentially more cost-efficient.
- Regional developer rates vary widely. For example, hourly rates in some regions may be $20-$40/hour, while in places like the UK they can be $150-$400/hour.
- For enterprise-grade apps, the actual development cost reflects not just features but also infrastructure, integrations, security, compliance, and multi-platform support — driving budgets well into the six-figure range.
Mobile App User Growth Statistics
Mobile app user growth usually plays a vital role in app success. Enhancing it can impact the reaction and impact an application. It goes without saying that with a more extensive user base, apps can gain more visibility, improve revenue, and establish a more substantial brand presence. Let us take you through stunning mobile app user growth rate stats.
- Stats prove that mobile applications take up over 90% of internet time.
- Since the smartphone revolution, the smartphone user base has grown by around 0.3 - 0.6 billion yearly.
- The number of smartphone mobile network subscriptions reached almost 6.4 billion in 2022, predicted to exceed 7.7 billion by 2028.
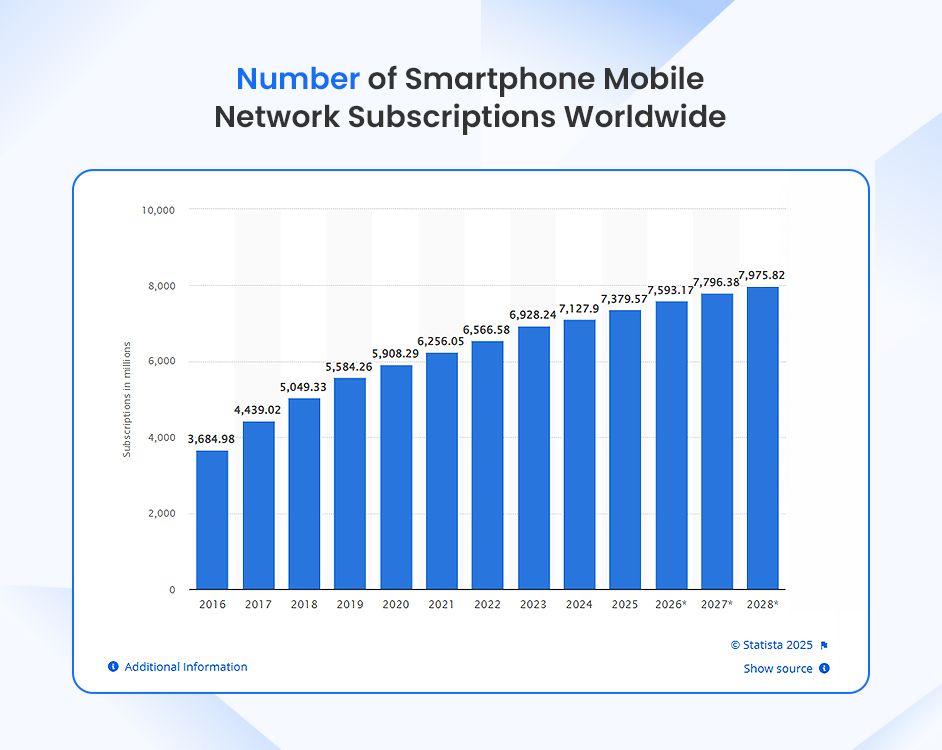
- Since 2022, the number of smartphone users worldwide has increased by about 38.4%, adding approximately 1.3 billion new users, bringing the total to around 4.69 billion by 2025.
- Global app downloads are projected to grow at a compound annual growth rate (CAGR) of around 8% from 2023 to 2027. For example, from 257 billion in 2023 to 299 billion in 2025.
- On average, a smartphone user in major markets spends approximately 2 hours and 51 minutes per day using mobile apps, reflecting increasing engagement year-on-year.
- In 2024, users collectively spent 4.2 trillion hours inside mobile apps, demonstrating how mobile is becoming central to digital behaviour.
- App usage in mobile devices in some markets now accounts for 60–65% of global internet traffic, while desktop usage falls toward the 38–40% range.
- The number of smartphone users globally is expected to reach 6.4 billion by 2029, representing a 30.6% increase (by 1.5 billion users) from current levels.
- Globally, mobile app downloads are projected to grow significantly, with users set to download nearly 2.9 trillion apps and games between 2021 and 2030, up 123% over the previous decade.
- In 2024, installs of e-commerce & shopping apps rose 17% year-on-year, and sessions increased by 13%, illustrating strong growth in that category.
- In the Middle East & North Africa (MENA) region, shopping app installs saw a 55% year-on-year increase, while sessions grew by 21%.
- Free apps continue to dominate, and global app downloads increased around 7% in recent years, with the Google Play Store leading in download volume.
- Globally, spending time in mobile apps averaged about 4.9 hours per day in 2025 — up from 4.1 hours in 2023 — marking growing user engagement.
- Mobile apps now account for roughly 88% of the time spent on mobile devices, with the majority of smartphone use occurring within apps rather than web browsers.
- In 2024, the Asia-Pacific region held the largest share of the global mobile app market, capturing 33%, followed by North America at 30% and Europe at 27%.
- The global mobile app industry is projected to grow at a Compound Annual Growth Rate (CAGR) of 8.58% between 2022 and 2027, reaching an estimated USD 756 billion by 2027.
- Global in-app spending and downloads continue to scale: for example, mobile app installs in many categories (especially gaming and strategy games) grew 83% year-on-year in 2024.

Mobile App Retention Rate Statistics
User retention is another primary focus for businesses developing mobile applications for their business growth. When measuring an app's success and sustainability, this aspect comes into the picture. With the help of mobile app retention rate statistics, businesses will have insights into who continues to use an application after their initial download.
Here's a table to help you understand the mobile app retention rate statistics.
| Mobile App Industry | Average Retention Rate Benchmark for 30+ days | Average Retention Rate Benchmark for 90+ days |
|---|---|---|
| Media & Entertainment | 43% | 24% |
| eCommerce/Retail | 37% | 18% |
| Travel & Lifestyle | 36% | 18% |
| Technology | 33% | 19% |
| Gaming | 27% | 10% |
- According to studies, Japan has the highest app retention rate, with 5.1%, while China has the worst, 1.3%.
- As per the latest Statista report, released in January 2024, the retention rate by 30 days of app categories depicts that social media was worst at 1.37% and news and magazines was at its best at 9.1% in 3rd quarter of 2023.
- 25% of the users abandon an application within the first day and a staggering 72% within the first 30 days, as reported by Statista.
- 80% of mobile apps fail in the 1st year after their launch.
Retention vs Downloads: The Real Challenge
A high number of app downloads doesn’t always mean lasting success. While installs might look impressive, many apps face a tougher battle — keeping users engaged. Low retention and high churn rates remain the biggest hurdles for sustainable app growth.
| Metric | Gaming Apps | Fintech Apps | Social Apps |
|---|---|---|---|
| Day 1 Retention | 28% | 35% | 40% |
| Day 7 Retention | 8% | 20% | 25% |
| Day 30 Retention | 5% | 12% | 15% |
Strategies to Boost User Retention
- Personalized Push Notifications: Apps leveraging AI-powered push notifications achieve up to a 2.5x increase in user retention, proving that tailored communication drives engagement. (Source: Localytics)
- Gamified Reward Systems: Platforms like Duolingo use features such as streak rewards, boosting 30-day retention rates by 22% and motivating users through consistency.
- Referral Incentives: Dropbox’s referral program famously increased user signups by 60%, demonstrating how incentivized sharing can turn users into brand advocates.
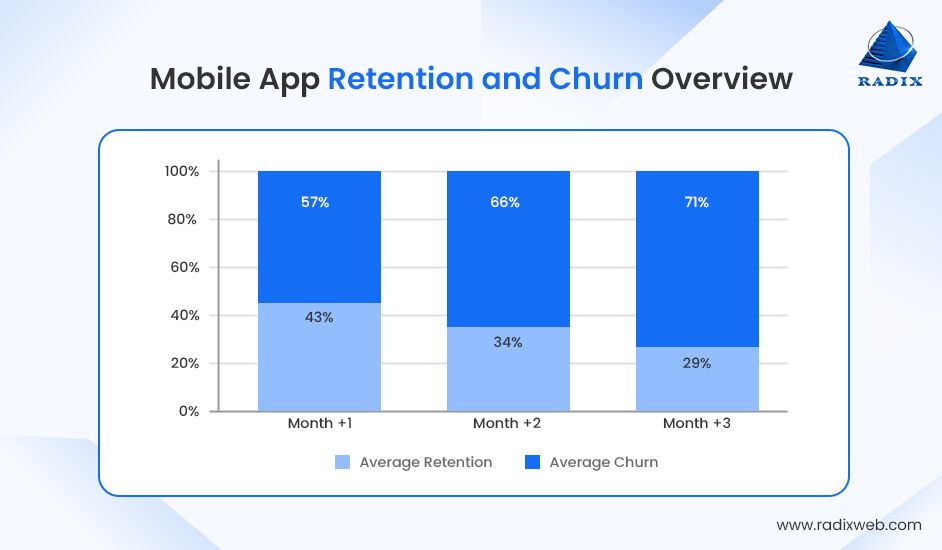
Mobile App Retention and Churn
Nearly 71% of users uninstall or stop using an app within 90 days of download. It’s a clear reminder that user retention is just as critical as acquisition for app success.
App Retention Rates by Category
Following are mobile app retention rates across different categories, revealing which types of apps keep users engaged the longest.
| App Type | Day 1 Retention | Day 30 Retention |
|---|---|---|
| Fitness | 35% | 12% |
| Gaming | 28% | 5% |
| E-commerce | 25% | 8% |
| Productivity | 40% | 15% |
Mobile App Engagement Statistics
Mobile app engagement stats are crucial for application developers. They provide insights into how users interact with apps, like the number of times they open it, how long they use it, and what features they engage with the most.
This data helps developers understand user behavior and make improvements to enhance the overall user experience. Let us look at a few prominent stats for the same.
- Organizations that use gamification as a part of their customer engagement strategy tend to experience a 54% increase in trial usage. Plus, there was a 15% increase in the buy clicks.
- The typical app user opens nine apps each day and 30 apps each month.
- Nearly 70% of users cast aside mobile apps because of their high loading time.
- After the first month after downloading, one in two apps are removed. Customers' lack of use is the primary cause of this.
- Almost 70% of the US digital media time comes from mobile applications.
- The average user checks their phone 58 times daily, with a significant portion of interactions happening inside apps.
- Mobile users spend over 4.5 hours daily on apps, with social media, messaging, and video streaming apps driving the highest engagement.
- Users actively engage with about 9-10 apps per day, but only around 30 apps see regular use each month.
- Gaming apps lead in session frequency, with users opening them multiple times daily, while finance and shopping apps see fewer but more intentional visits.
- Push notifications can boost engagement by up to 88%, but excessive notifications risk app abandonment.
Application Development Statistics
Applications have taken the world over in a storm. It is quite fascinating to watch how the application market has grown exponentially over the years. Moreover, with millions of apps available on different platforms like Play Store, and App Store, it is evident that mobile apps have become an integral part of our lives.
Let's look at the digits and uncover the importance they hold for the world of app development.
- In 2025, the on-demand mobile app business increased to nearly $330 billion.
- The global PWA market has a reported value of around $2 billion by the end of 2024 and is expected to grow at a CAGR of 31.9% to reach $10.44 billion by 2027, according to Emergen Research’s latest report.
Conclusion
The write-up on mobile app statistics for 2026 is an invaluable resource, especially for everyone looking forward to making the most out of their mobile applications and enhancing their brand visibility.So, if you’re all geared up to make data-driven decisions, enhance your user experience, monetize opportunities, and gain a competitive advantage, understanding mobile app stats is crucial. Yet again, it is essential to interpret them in the context of your specific business goals and target audience. With proper analysis and implementation, mobile app stats can help you quickly transform your business and achieve success in the digital landscape.If you need more, Radixweb is here to provide cutting-edge mobile application development services that integrate in-depth insights and know-how with the latest development techniques, helping you make the most of your mobile apps.Talk to our experts and get started with your mobile app development journey today!


Explore More Topics
Ready to brush up on something new? We've got more to read right this way.
Get top Insights and news from our technology experts.